Analysis of Sales and Profits by Customer and Segment
Overview
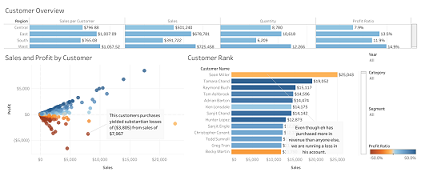
This Tableau interactive dashboard was created to analyze the sales and profit by customer and segment of this sample data. Hover your mouse on top of any circle on the scatterplot to get the details of the sales and profits by customer, or use the filters on the right hand side to change the category, segment or year.
Live demo (opens full screen in a new window):